The data visualization helps you understand your data using graphs and different charts. There are a lot of tools used for making this thing simple such as Excel spreadsheet, Tableau software, Power BI and more.
But most of the jobs required to work with data will ask you to have data visualization skills and represent these graphs using language such as python. This article will help you learn using the library called matplotlib to visualize your data.
1. Installing The Environment
Before you start programming with python and create data visualization using the matplotlib library, you need to install an IDE, an integrated development environment that we use to add the code, and it will execute it for us.
There are a lot of IDEs that work with python, such as PyCharm, Sublime Text, Anaconda, and more. Still, this tutorial will use Jupyter Notebook because it is popular and work well with data visualization. Feel free to use any IDE you want.
2. Installing The Libraries
Matplotlib library is not installed by default when you install the python language interpreter on your computer. So we need to install it using the pip3 command:
!pip3 install matplotlib #Installing the libraryOnce this library is installed successfully, you will get a message telling you that it has been installed. We are now ready to start this journey on data visualization using matplotlib.
3. Line Plot
Matplotlib library is open-source, which means there is a lot to learn in this library. It has so many modules to use, and every module has its methods to discover. So I will use the Pyplot module in this tutorial since it is the most used among developers.
This module, known as Pyplot, can create various plots such as Histograms, Line Plots, Scatter Plot, and much more. Let’s now start this tutorial by creating a simple line plot using the Pyplot module:
import matplotlib.pyplot as plt #Importe the library
plt.plot([20, 22, 24, 26]) #Create a line plot
plt.show() #Show the plots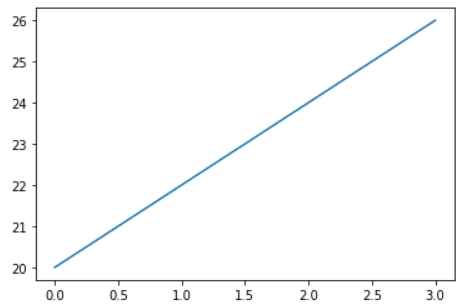
You see a line plot graph created using the .plot() from Pyplot but let’s explain the code behind this graph. First of all, we’ve imported the Pyplot module from the matplotlib library as a plt which means whenever you want to use Pyplot, use the plt keyword instead to make things easier for you.
We use the .plot() function (method) to plot the data on the graph, and it needs some data to make that line plot. So we’ve created some random data as shown above in the code. Finally, you will need to use the .show() function from the Pyplot module to display the graph.
3.1. Add The X-axis
You may notice that the line plot also needs to specify the X-axis, and we’ve only defined the Y-axis, and the matplotlib has created some random data for the X-axis. Let’s see how you can define X-axis data for the plot:
import matplotlib.pyplot as plt #Importe the library
plt.plot([10, 12, 14, 16], [20, 22, 24, 26]) #Create a line plot
plt.show() #Show the plots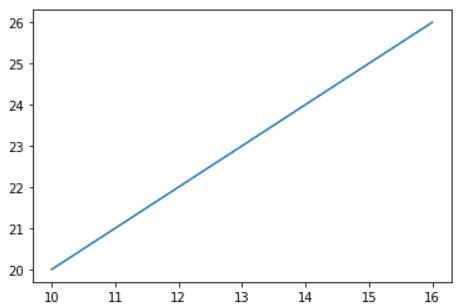
From the code above, you can see that we’ve added the X-axis data to the .plot() function in the first place, so now you know that the first data is recognized as the X-axis and the second one is the Y-axis.
3.2. Add Titles
Also, you may notice many other things missing in the graph, which are the names of the X-axis, Y-axis, and the graph title. Adding these names should be a challenging task while using the matplotlib library so let’s see how you can implement this:
import matplotlib.pyplot as plt #Importe the library
plt.plot([10, 12, 14, 16], [20, 22, 24, 26]) #Create a line
plt.xlabel("X-Label") #Name for the X-label
plt.ylabel("Y-Label") #Name for the Y-label
plt.title("Line Plot") #Name of the Graph
plt.show() #Show the plots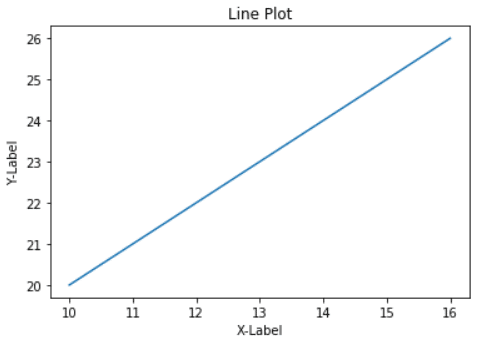
You can see that we’ve only added two lines of code in the code snippets above, which is the .xlabel() function to add a name for the X-axis data and the .ylabel() function for adding the name for the Y-axis.
3.3. Customizing The Text
We can customize the plot much more, such as changing the color of the lone and the title’s font size. Let’s see an example for changing the text of the title:
import matplotlib.pyplot as plt #Importe the library
plt.plot([10, 12, 14, 16], [20, 22, 24, 26]) #Create a line
plt.xlabel("X-Label") #Name for the X-label
plt.ylabel("Y-Label") #Name for the Y-label
plt.title("Line Plot", fontsize=20, color="red") #Name of the Graph
plt.show() #Show the plots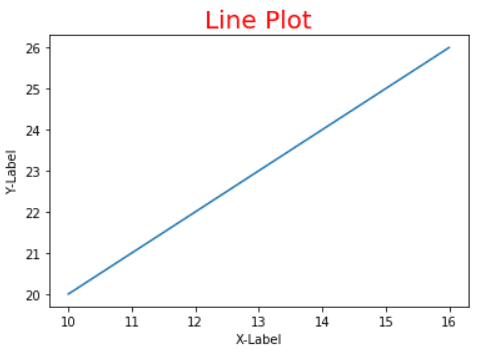
You can see the font size becomes bigger, and the color has been changed. You can apply the same to the other texts of the graph. We’ve just explored a straightforward line plot, but matplotlib can do a lot more than this simple one.
4. Scatter Plot
One of the most used plots is called scatter plots, which uses dots to display values in the graph. Let me show you an example:
import matplotlib.pyplot as plt #Importe the library
plt.scatter([10, 12, 14, 16], [20, 22, 24, 26]) #Scatter plot
plt.xlabel("X-Label") #Name for the X-label
plt.ylabel("Y-Label") #Name for the Y-label
plt.title("Scatter Plot") #Name of the Graph
plt.show() #Show the plots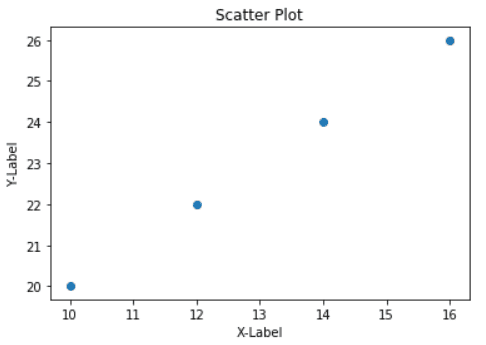
The code shows you that everything is the same as the previous line plot, except instead of using the .plot() for creating the line plot, we’ve used the .scatter() to make this scatter plot. We can change the dots to any shape we want using the marker argument:
import matplotlib.pyplot as plt #Importe the library
plt.scatter([10, 12, 14, 16], [20, 22, 24, 26], marker = "*") #Scatter plot
plt.xlabel("X-Label") #Name for the X-label
plt.ylabel("Y-Label") #Name for the Y-label
plt.title("Scatter Plot") #Name of the Graph
plt.show() #Show the plots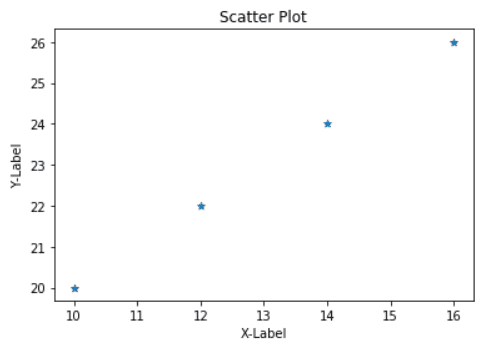
You can see that the dots become asterisks, and you can make any shape you want instead of the default dots.
5. Bra Plot
One of the most used charts also is the bar plot. Let’s see how to create one using the matplotlib library:
import matplotlib.pyplot as plt #Importe the library
plt.bar(["A", "B", "C", "D"], [20, 22, 24, 26]) #Bar plot
plt.xlabel("X-Label") #Name for the X-label
plt.ylabel("Y-Label") #Name for the Y-label
plt.title("Bar Plot") #Name of the Graph
plt.show() #Show the plots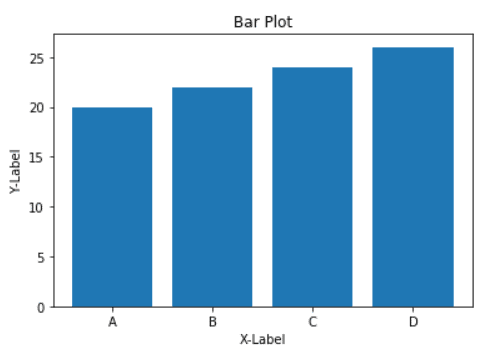
We’ve used the .bar() function to plot the bar plot, and you need to specify the X-axis & Y-axis as any other plot we already did.
Conclusion
Thanks for reading! This simple guide taught people how to use the matplotlib library for data visualization, and we’ve learned the very basics of its commands. We will share many other advanced things about this library and how to use pandas to import data from another resource.