Pandas developers have created this library to be one of the most completed tools for working with data, such as getting information about your Data or applying statistics calculations or data visualization. We’ve explored some of its functions in the past tutorials, and we will deep dive more into this library.
1. Processing Data
We’ve already seen some of the pandas functions to work with data in the second part of the Pandas In Python article, and we will complete learning more on this topic. So let’s get started.
1.1. Remove Missing Value
Often, when you work with a large dataset, you may find some cells that don’t contain a value. Because it will sometimes give you an error in some visualization software, or maybe the analysis won’t be accurate.
Pandas have a built-in function to detect these missing values and remove them automatically. Let’s an example:
import pandas as pd

# Import the CSV data
df = pd.read_csv("titanic.csv")

# Remove the missing values
df.dropna()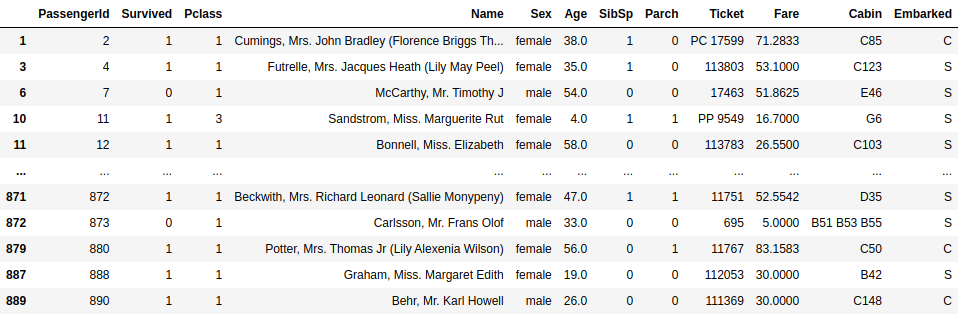
From the picture, you can see that some rows are not there, like 2, 4, 5, 872, 873, to name a few. These rows have missing values, and you need to remove these values before starting your analysis. The .dropana() function removes the rows that contain these missing values.
1.2. Extracting The Data
Sometimes you need to work only a portion of your data to make your analysis or maybe visualization. You can extract these few rows from the data in pandas with a built-in function:
import pandas as pd

# Import the CSV data
df = pd.read_csv("titanic.csv")

# Extracting the rows & columns
df.iloc[3:5,2:7]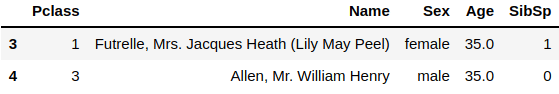
The picture above shows that we’ve extracted rows number 3 and 4 and some columns in the dataset. We make use of the .iloc[] function, and you specify the range of the rows where to start extracting.
We’ve extracted from row number 3 to number 5, but the number 5 is not included in the count. That’s why you get rows 3 and 4 in the example. Let’s say you need to extract specific columns precisely, not a range of columns like you’ve seen in the previous example. Try this new command:
import pandas as pd

# Import the CSV data
df = pd.read_csv("titanic.csv")

# Extracting the rows & columns
df.loc[3: 5,["Name", "Age"]]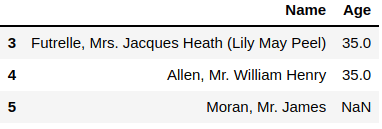
We’ve used the .loc[] function to extract specific columns from the dataset, and you need first to specify the columns range and then specify the columns name.
In some situations, you need to extract the rows that contain values under or above a specific value like age above 20 or something. This type of extract is called conditional selection, and let’s see an example of this:
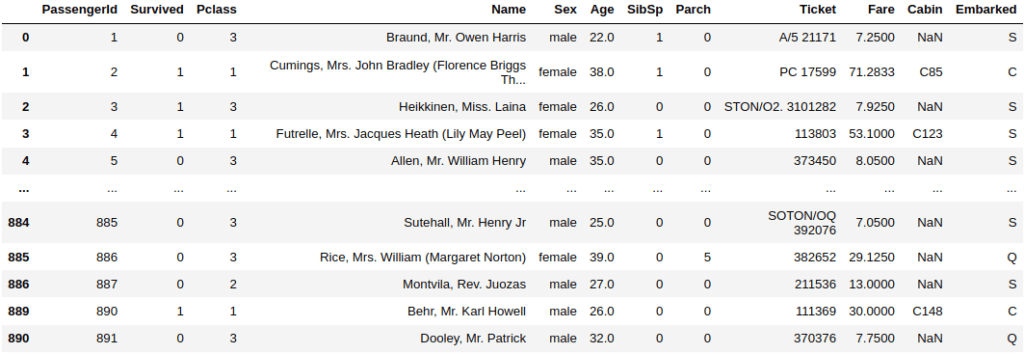
You can see the Age column with values over 20, and the above example has access to that Data using the df[“Age”] and tell pandas to extract the data above 20 in the Age column.
2. Statistics Information
Pandas also have many built-in functions that can perform these actions efficiently, and let’s explore some of them.
2.1. Calculate The Mean
The mean in statistics is calculated by summing the values of the whole numbers divided by the total number of the numbers, not its values. Let’s see an example of calculating the mean in pandas:
import pandas as pd

# Import the CSV data
df = pd.read_csv("titanic.csv")

# Getting the mean
df.mean()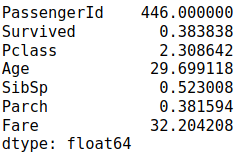
You can see we’ve used the .mean() function to calculate the mean of the columns that have numerical values without even specifying them.
Pandas will apply this function on any column with numerical values since you can’t apply it to string values. Let’s say you want to have the mean of a specific column. You will need to use the following command:
import pandas as pd

# Import the CSV data
df = pd.read_csv("titanic.csv")

# Getting the mean
df.Age.mean()
You can see from the code that you need to specify the column you want to calculate its mean, the Age column, and apply the mean() function.
This method will be beneficial instead of applying it to the whole dataset, and it can take a long time if you have an extensive dataset, although you need to calculate only one column.
2.2. Calculate The Number Of Values
Let’s say you want to calculate the number of values in every column has, and it is not always necessary that the number of rows is the number of values in that column because of the missing values. Let’s see an example:
import pandas as pd

# Import the CSV data
df = pd.read_csv("titanic.csv")

# Getting the number of values
df.count(axis = 0)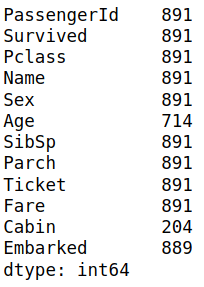
You can see that most values are 891, which is precisely the number of rows in the dataset, but not all of the columns have the same number. That means you have missing values in these columns.
The .count() function will try to count the number of values in every column, and you need to pass the axis index 0 indicates that you want to calculate the number of the values in every column, and 1 means the number of values in every row.
Conclusion
Thanks for reading! The article has shown you the popular functions to work with data, like removing missing values, extracting the data, applying statistical calculations on your data like the mean. We will explore more functions of the pandas library in the following tutorial.