Pandas is one of the best and most used libraries for data processing among data scientists and data visualization. This tool can perform many operations that you probably need to perform on your data in just one tool and with simple commands. We’ve talked about pandas in a previous tutorial before, and now we will explore more about this library.
1. Working With Data
1.1. Read The Data
Before you jump to processing your data, like changing its shape or removing duplicates, you need to understand it and get as much information as possible. Let’s first try to import the data and show some of its rows:
import pandas as pd

# Import the CSV data
df = pd.read_csv("titanic.csv")

# Showing the data
df.head()
Download the dataset first from this link. You’ve learned in the previous tutorial that we’ve used the pd.read_csv() to read the data and the .head() function for showing the data.
By default, it shows the first five rows start counting from 0 till the row number 4, but you can change the number of rows you want to see by specifying the number of rows in the .head() function:
import pandas as pd

# Import the CSV data
df = pd.read_csv("titanic.csv")

# Showing the data
df.head(7)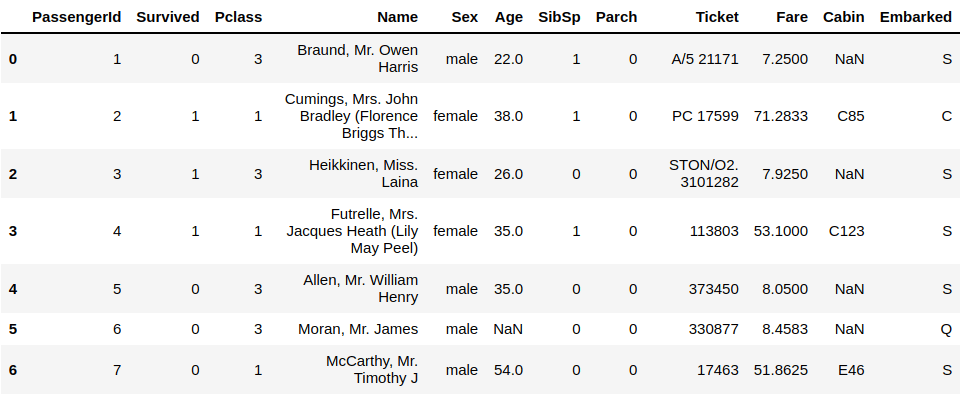
Also, you can see the very last values of your data using this simple command which is the .tail() function:
# Showing The Last Data
df.tail()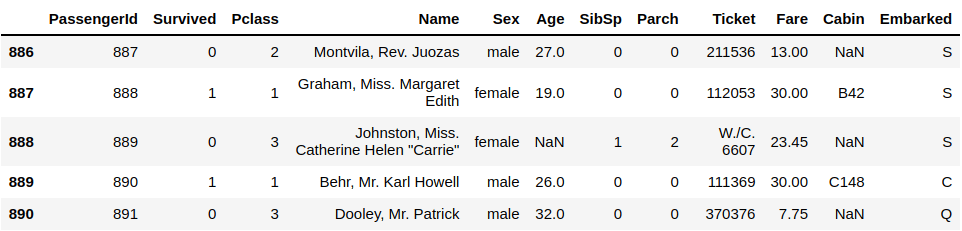
It shows the last 5 rows by default. But you can change it also by adding a number inside the closing parenthesis:
# Showing The Last Data
df.tail()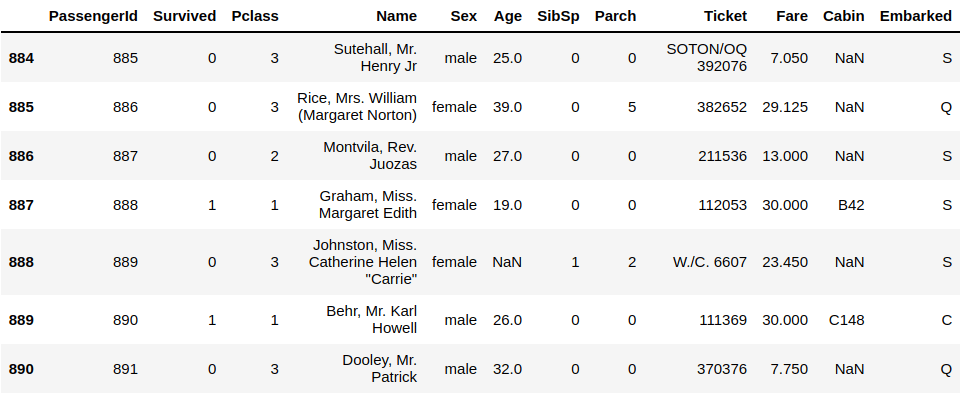
1.2. Get The Data Information
When you import your data, you may need to know more information about your data rather than just seeing the columns or knowing the number of rows & columns. Let’s explore more information about this titanic dataset:
# Show The Data Information
df.info()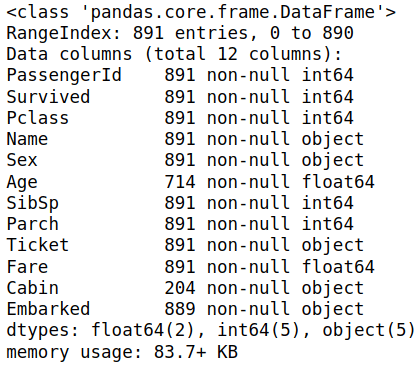
It shows much other information about your data and the type of every column like float64 and int64, how much memory your data is taking. It will be vital to have extensive data and much other helpful info.
1.4. Summary Statistics
Also, you need to get summary statistics of your data like the sum, median, mean, and many others for every column in your dataset. It may seem not very easy, but pandas developer has made it easy to calculate all of this. Let’s see an example:
import pandas as pd

# Import the CSV data
df = pd.read_csv("titanic.csv")

# Showing the statistics
df.describe()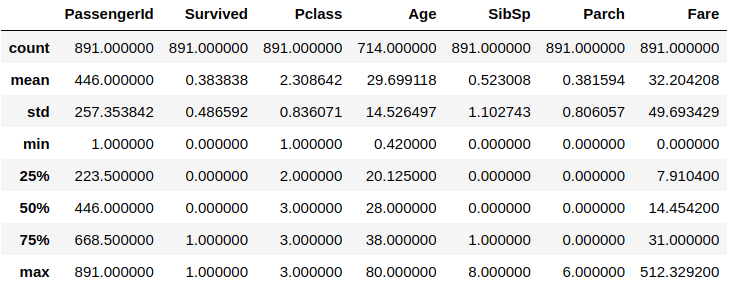
The command may take some time to calculate all of these summary statistics depending on how much your data is and the power of your computer. We’ve used the .describe() function, and you got the mean of every column and the std, which is the standard deviation, the minimum value, the maximum value, and more.
2. Processing The Data
You know now how to get some information about your data so let’s try to work with data like changing its columns name, removing duplicate values, handling missing values, extracting the data, and more.
2.1. Removing Duplicate Value
Sometimes, while viewing the data, you may find duplicate values. You need to remove them first because they will later affect your analysis and visualization. That will probably lead to an inaccurate result. To remove them, you will use this command:
import pandas as pd

# Import the CSV data
df = pd.read_csv("titanic.csv")

# Remove the duplicate values
df.drop_duplicates(subset = "Name", keep = False)
You can see we’ve used the df.drop_duplicates() function to remove the duplicate values in the dataset. Still, you need to specify the column you want to remove its duplicate value, which you will set by using the subset argument and specifying the column name, Name in this example.
The second argument is “keep” and set it to False, meaning considering all the same values are duplicates.
2.2. Change The Column Name
Let’s suppose you want to rename a column in your dataset. There is a built-in function in the pandas library to perform this action:
import pandas as pd

# Import the CSV data
df = pd.read_csv("titanic.csv")

# Rename the column
df.rename(columns = {"Survived" : "Survivors"}, inplace = True)

# Show the data
df.head()
You can see that the column Survived has been renamed to Survivors, and the argument “inplace” is set to True.
2.3. Changing Multiple Columns Names
This example showed you changing the column name, but what if I change many columns’ names? Let us see a simple example of changing many columns in one command instead of keeping typing them one by one:
import pandas as pd

# Import the CSV data
df = pd.read_csv("titanic.csv")

# Rename the column
df.rename(columns = {"Survived" : "Survivors", "Sex" : "Gendar"}, inplace = True)

# Show the data
df.head()
Now, you can see that we could change two of the names of the columns using the df.rename() function that we’ve used in the previous example.
2.4. Detect Missing Values
Missing values in the dataset is a big problem that may ruin your analysis. Fortunately, pandas offer a built-in function to detect the missing values inside your dataset. Let’s see together an example of this:
import pandas as pd

# Import the CSV data
df = pd.read_csv("titanic.csv")

# Detect the missing values
pd.isnull(df)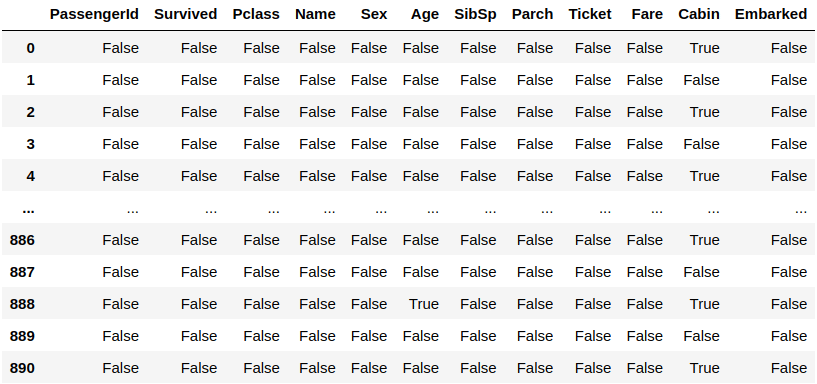
After executing the previous code, you will notice many False expressions meaning these values are available, and if they are missing, you will get the True expression. We’ve used the pd.insull() function to detect these missing values and pass the dataset you are using it.
Conclusion
Thanks for reading! This article has shown you many of the most used pandas functions for getting the information about your dataset before the processing phase and some useful functions to work with this data.